

Part of the series of comics on dating and/or math.
Part of the series of comics on dating and/or math.

Part of a series of comics on dating and math.
Emily McDowell at mcsweenys.net chronicled her experience with online dating with her Dater’s Index. Here’s a selection:
Find the full version here.

Part of the series of comics on dating and math.

Part of the series of comics on dating and math.
I admit, it’s a stretch to call this one ‘math-related’, but math people like making lists, right? Plus, it’s xkcd.

Part of the series of comics on dating and math.

Part of the regular series of comics on dating and math.
Robin Weis, the same girl who brought us 8 years of dating data, tracked her crying patterns for 589 days, rating them on a scale from ‘a tear or two’ to ‘I am a crumpled pile of flesh’. She cried on 216 of those days. And I thought I cried a lot.
Number of Cries Per Day

She categorized each cry into 8 general categories, shown in the graph below. The mound of purple life-related cries on the left side was largely during a 10 week trip to Europe. A large proportion of her cries were breakup and relationship related, which included finding out her boyfriend was married. Yep, that’s bound to cause some tears. Check out her full post here.
Categories of Cries Over Time

What I’ve found interesting
As I’m taking my first steps into the world of online dating (I just signed up to OKCupid for the first time) it can be a little scary seeing the amount of angst relationships can cause. Might I be more comfortable staying safely single?
I hate to be yet another blog that touts the benefits of travel, but my experience with travel is relevant here. Even though I spent a lot of time being unhappy while traveling, overall it was a rewarding experience that enhanced my life and I’d do it again. As for dating, it’s a risk I’m willing to take.
Inspired by this xkcd comic, I built an interactive graph and calculator. You can use it to test whether your current relationship is socially acceptable or to calculate what age is too young or too old for you to date. (It might take a few seconds to load.)
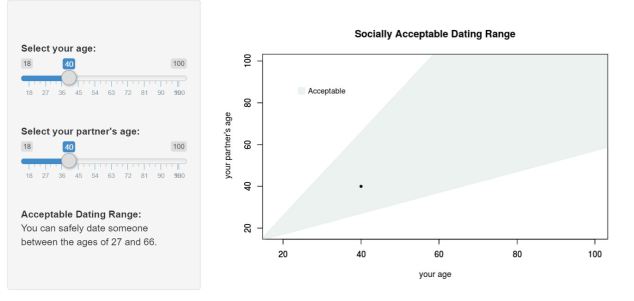
For the occasions when you need to quickly calculate whether pursuing a person of a particular age would be objectionable, here are the formulas:
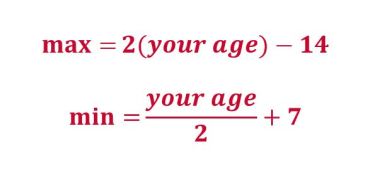
So according to this, I could date a guy between the ages of 21 and 42. Personally, it’s wider than I’d probably date. My preferred minimum would be around 25 and maximum around 38, but for a rule of thumb, the calculations don’t seem too far off.
However, the older we get, the calculations start getting outrageous: A 51 year old can date an 88 year old? At 60 you can date anyone between the age of 37 and 106? Something seems off.
Lucky for us, Psychology Today investigated this question by studying whether these formulas reflect people’s real preferences.
Here’s a summary of their findings:
You can read more here.
Now, who will create a more accurate calculation?
For anyone interested in learning how I built this app, here’s the code. If you know R, Shiny apps are surprisingly easy to create. Check out the tutorials at shiny.rstudio.com.
# range.R

# Calculate dating range and create text

range <- function(age){

     max_age <- function(x) 2*x - 14
     min_age <- function(x) .5*x + 7

     youngest <- min_age(age)
     oldest <- max_age(age)

     paste("You can safely date someone between the ages of ",
          floor(youngest), " and ", floor(oldest),
          ".", sep = "" )

}


# plot.R

age_plot <- function(){

     #set equations for lines
     top <- function(x) 2*x - 14
     bottom <- function(x) .5*x + 7

     #set the shading color
     color = rgb(232, 240, 237, max = 255, alpha = 225)

     # graph top line and titles
     curve(top, xlim = c(18,100), ylim = c(18,100),
          xlab = "your age", ylab = "your partner's age",
          main = "Socially Acceptable Dating Range",
          col = color)

     # fill between lines
     top.x <- seq(0,110,.01)
     bottom.x <- seq(0,110,.01)
     top.y <- top(top.x)
     bottom.y <- bottom(bottom.x)
     x <- c(bottom.x, rev(top.x))
     y <- c(bottom.y, rev(top.y))

     polygon(x, y, col = color, border = color)

     # graph bottom line to add border again
     # (there must be a better way!)
     par(new=TRUE)
     curve(bottom, xlim = c(18,100), ylim = c(18,100),
          xlab = "", ylab = "", col = color)

     # add legend
     legend(23,90, legend = "Acceptable" ,
          cex = .9, pch = 15, bty = "n",
          col = color, pt.cex = 2)
}


# ui.R age_range

library(shiny)

shinyUI(fluidPage(

   # Sidebar with a slider input for each age
   sidebarLayout(
     sidebarPanel(

          br(),
          sliderInput("your_age",
               "Select your age:", min = 18,
               max = 100, value = 40
          ),
          br(),
          sliderInput("partners_age",
               "Select your partner's age:", min = 18,
               max = 100, value = 40
          ),
          br(),

          # Display the text
          strong("Acceptable Dating Range:"),
          textOutput("text1"),
          br()
     ),

     # Display the Acceptable Age Range Graph
     mainPanel(
          br(),
          plotOutput("plot")
     )
 )
))

# server.R Age Range Graph

library(shiny)
source("plot.R")
source("range.R")

shinyServer(function(input, output) {


     output$plot <- renderPlot({

          age_plot()

          # graph data point, using input from sliders
          points(input$your_age, input$partners_age, pch=20)

     })

     # Create text using input from your_age slider
     output$text1 <- renderText({
          range(input$your_age)

     })
})

