
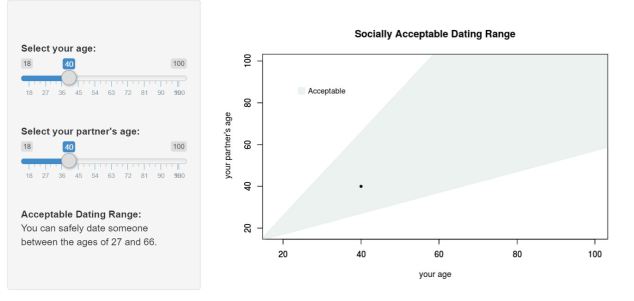
Inspired by this xkcd comic, I built an interactive graph and calculator. You can use it to test whether your current relationship is socially acceptable or to calculate what age is too young or too old for you to date. (It might take a few seconds to load.)
The Equations
For the occasions when you need to quickly calculate whether pursuing a person of a particular age would be objectionable, here are the formulas:
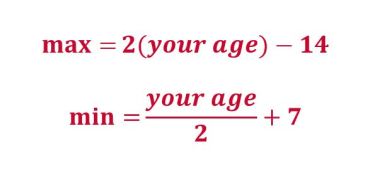
So according to this, I could date a guy between the ages of 21 and 42. Personally, it’s wider than I’d probably date. My preferred minimum would be around 25 and maximum around 38, but for a rule of thumb, the calculations don’t seem too far off.
However, the older we get, the calculations start getting outrageous: A 51 year old can date an 88 year old? At 60 you can date anyone between the age of 37 and 106? Something seems off.
How well do the formulas work?
Lucky for us, Psychology Today investigated this question by studying whether these formulas reflect people’s real preferences.
Here’s a summary of their findings:
- Men’s preferred minimum age for a partner is close to the formula’s minimum.
- Both sexes’ preferred maximum age is much younger than what the formula calculates.
- Women’s preferred minimum acceptable age is older than what the formula calculates.
- The younger you are, the more accurate the calculations.
You can read more here.
Now, who will create a more accurate calculation?
The Code
For anyone interested in learning how I built this app, here’s the code. If you know R, Shiny apps are surprisingly easy to create. Check out the tutorials at shiny.rstudio.com.
# range.R

# Calculate dating range and create text

range <- function(age){

     max_age <- function(x) 2*x - 14
     min_age <- function(x) .5*x + 7

     youngest <- min_age(age)
     oldest <- max_age(age)

     paste("You can safely date someone between the ages of ",
          floor(youngest), " and ", floor(oldest),
          ".", sep = "" )

}


# plot.R

age_plot <- function(){

     #set equations for lines
     top <- function(x) 2*x - 14
     bottom <- function(x) .5*x + 7

     #set the shading color
     color = rgb(232, 240, 237, max = 255, alpha = 225)

     # graph top line and titles
     curve(top, xlim = c(18,100), ylim = c(18,100),
          xlab = "your age", ylab = "your partner's age",
          main = "Socially Acceptable Dating Range",
          col = color)

     # fill between lines
     top.x <- seq(0,110,.01)
     bottom.x <- seq(0,110,.01)
     top.y <- top(top.x)
     bottom.y <- bottom(bottom.x)
     x <- c(bottom.x, rev(top.x))
     y <- c(bottom.y, rev(top.y))

     polygon(x, y, col = color, border = color)

     # graph bottom line to add border again
     # (there must be a better way!)
     par(new=TRUE)
     curve(bottom, xlim = c(18,100), ylim = c(18,100),
          xlab = "", ylab = "", col = color)

     # add legend
     legend(23,90, legend = "Acceptable" ,
          cex = .9, pch = 15, bty = "n",
          col = color, pt.cex = 2)
}


# ui.R age_range

library(shiny)

shinyUI(fluidPage(

   # Sidebar with a slider input for each age
   sidebarLayout(
     sidebarPanel(

          br(),
          sliderInput("your_age",
               "Select your age:", min = 18,
               max = 100, value = 40
          ),
          br(),
          sliderInput("partners_age",
               "Select your partner's age:", min = 18,
               max = 100, value = 40
          ),
          br(),

          # Display the text
          strong("Acceptable Dating Range:"),
          textOutput("text1"),
          br()
     ),

     # Display the Acceptable Age Range Graph
     mainPanel(
          br(),
          plotOutput("plot")
     )
 )
))

# server.R Age Range Graph

library(shiny)
source("plot.R")
source("range.R")

shinyServer(function(input, output) {


     output$plot <- renderPlot({

          age_plot()

          # graph data point, using input from sliders
          points(input$your_age, input$partners_age, pch=20)

     })

     # Create text using input from your_age slider
     output$text1 <- renderText({
          range(input$your_age)

     })
})

I am sending this to my husband who is a prof of bio-stats and 16 years older then me.
LikeLiked by 1 person
PS- This is the first time I actually chose to do mathematical calculations for fun. Hilarious.
LikeLiked by 2 people
I did it. I can date someone between the ages of 36.9 and 104. This really has opened up my options should I need to enter the dating pool.
LikeLiked by 1 person
Haha! Yes, you sure wouldn’t be starved for choice.
LikeLike
Wow! You are such a clever girl!!!! That is absolutely brilliant!
My acceptable age range is 20 to 40. Given that I am in my late 20s, I would go for the mid point, that is, 30.
LikeLiked by 2 people
By the way, I like that you cited Psychology Today. I can spend hours on that website. 🙂
LikeLike
Aww thanks, Pinky. Yeah, 20 seems a bit young.
LikeLike
Omgosh! I’m married, but I did this for fun. Here’s the result: “You can safely date someone between the ages of 28 and 70.” What in the who hay? 28 is a bit young, although I have friends that age; I can’t imagine if I was in the dating pool that I would actually date a 28 year old man – eek! And 70??? Well, that’s old enough to be my dad. That was fun though.
LikeLiked by 1 person
Wow, that’s quite a range! Judging by everyone’s reactions to the results, I think the equations could use an update!
LikeLike
Yeah, they gave me a higher number than I would ever go past. I wouldn’t look for anything past 34.
LikeLiked by 1 person
I’m starting to wonder if the rule of thumb was created by creepy guys wanting to justify dating much younger women…
LikeLiked by 1 person
That sounds about right!
LikeLiked by 1 person
Umm, I’m not dating a 68 year old. That’s weird as hell.
LikeLiked by 1 person
But it’s great for the 68 year old! haha…
LikeLiked by 1 person
Ewww!
LikeLike